Projects /Advanced FEA Module — DCU 2026
Nonlinear FEA ANSYS Mechanical Contact Mechanics Plasticity · Hyperelasticity SolidWorks · Parametric Study

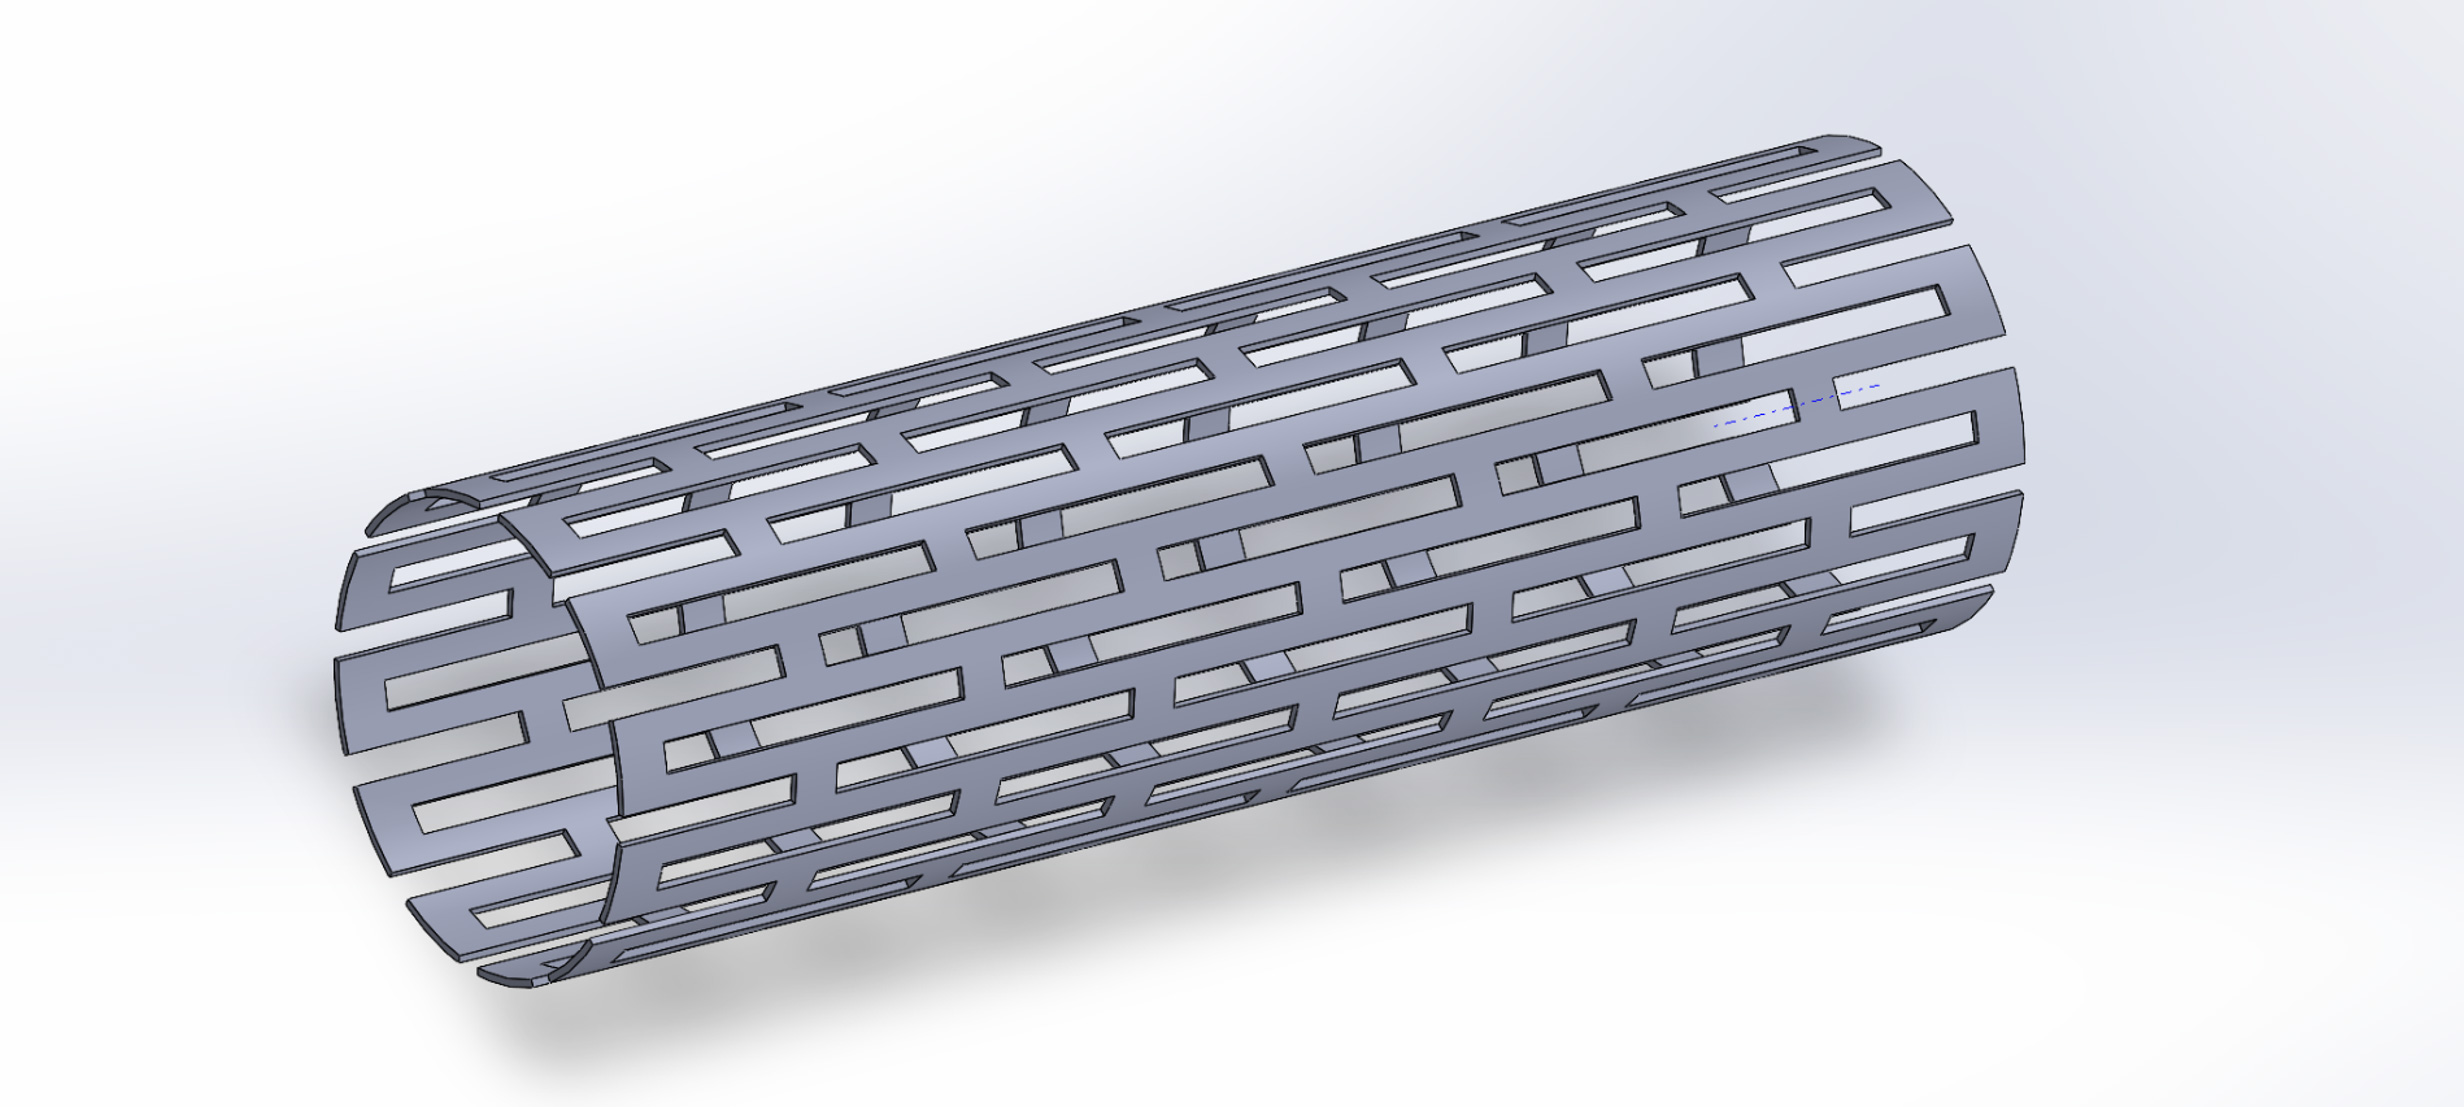
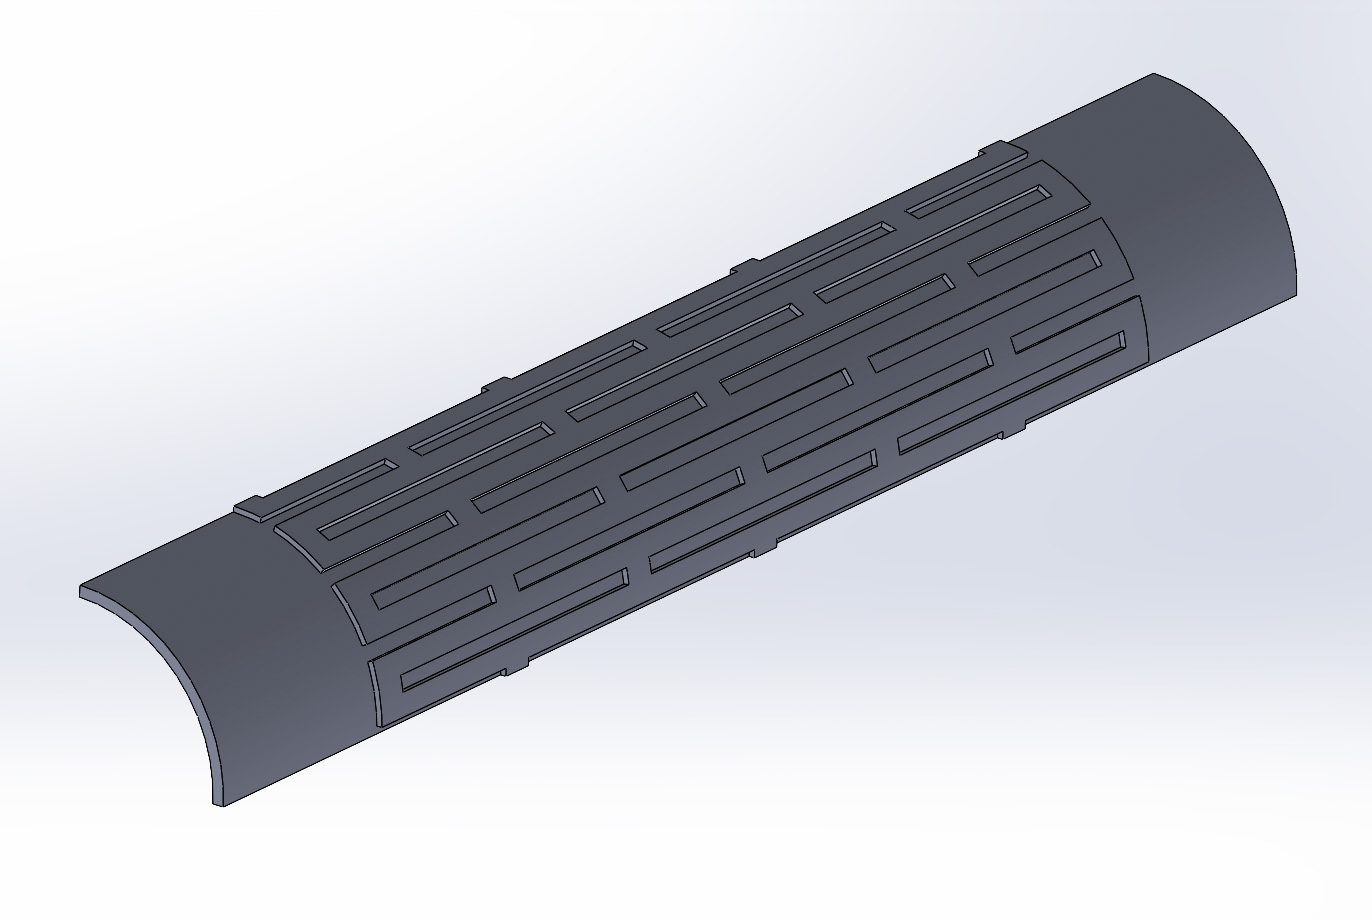
Nonlinear Simulation of Balloon-Expandable Stent Deployment

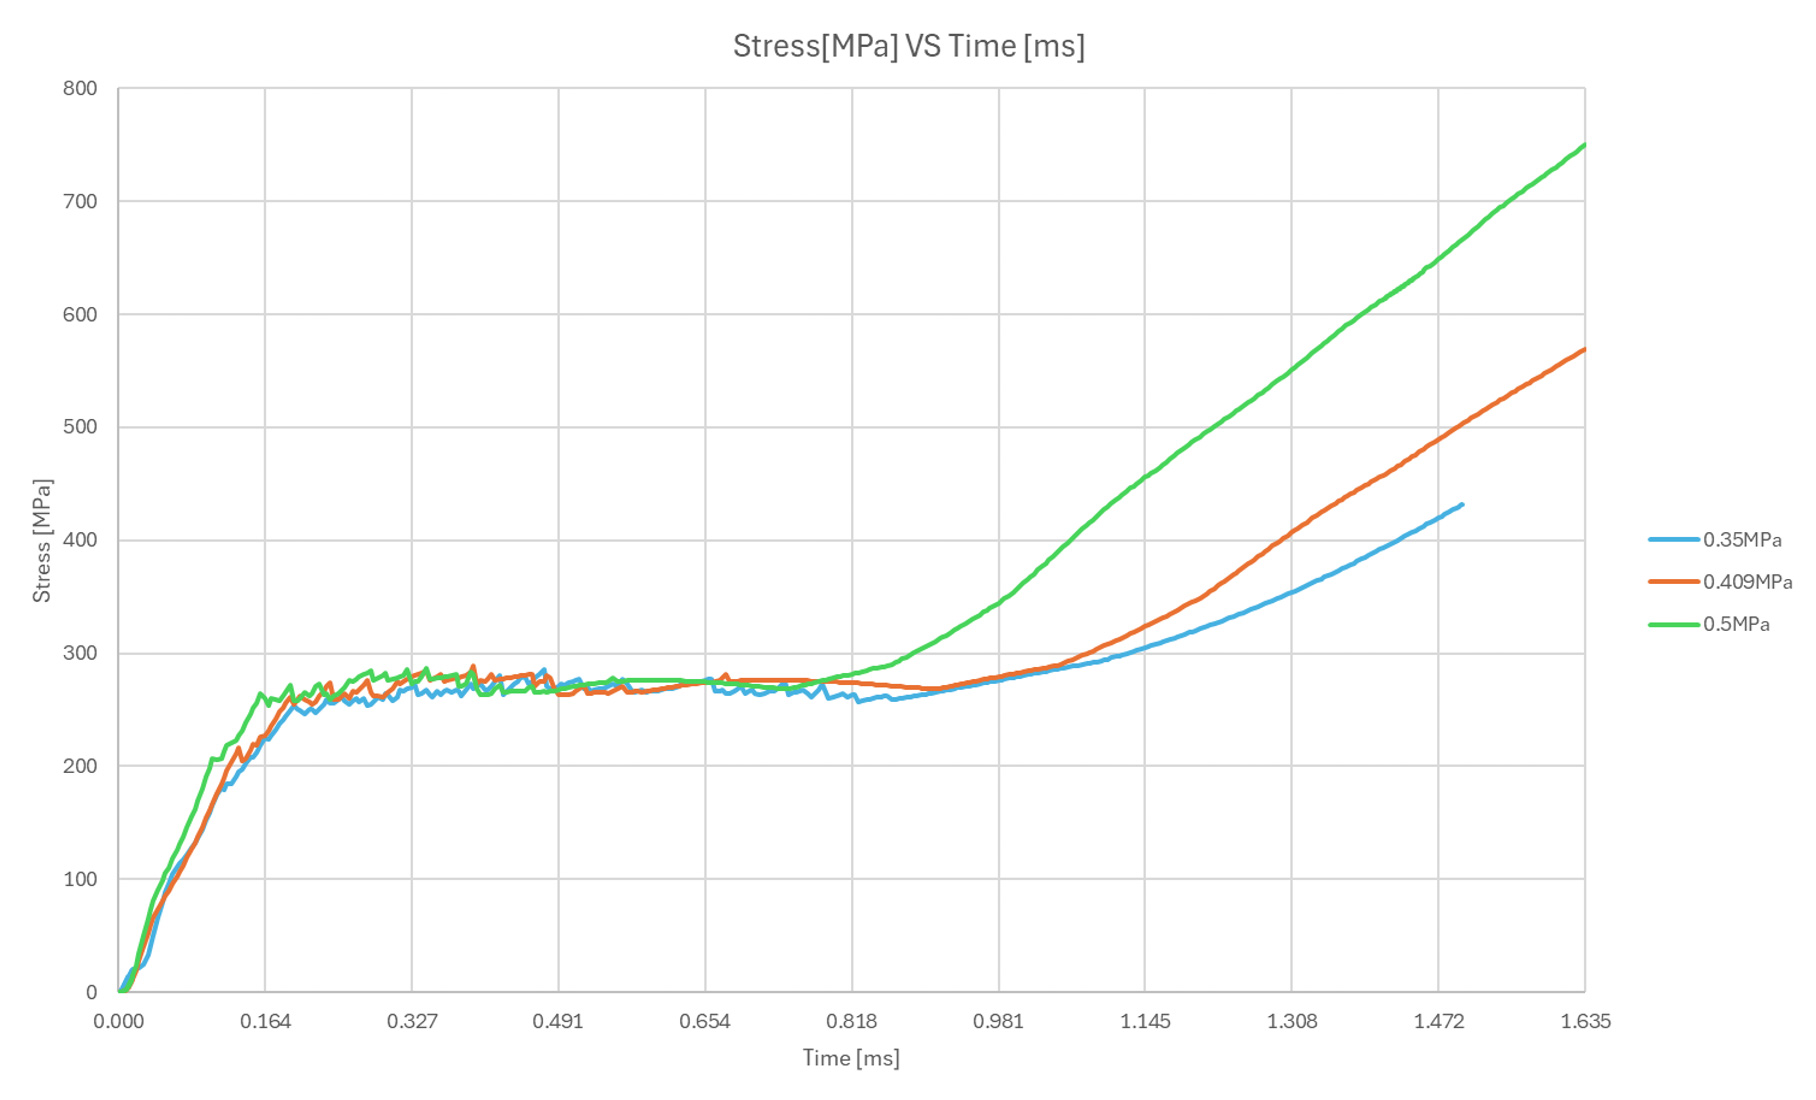
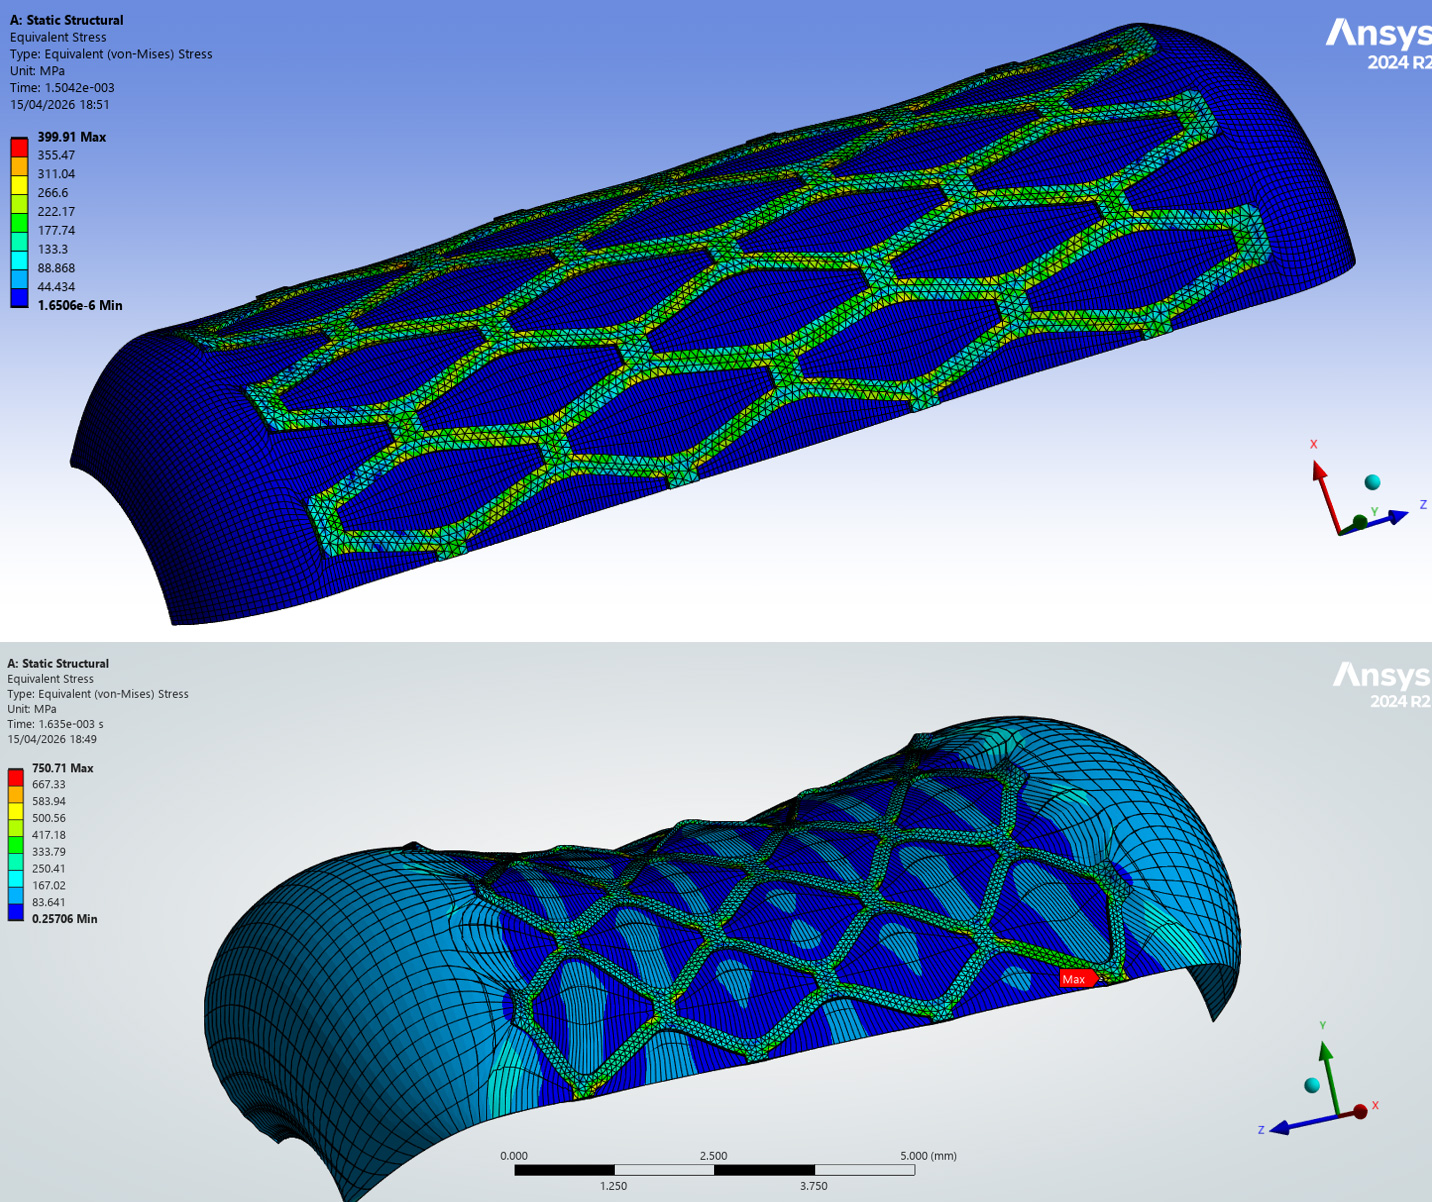
A highly nonlinear finite element study in ANSYS Mechanical investigating the kinematic expansion and plastic deformation of a cardiovascular stent under balloon inflation — validated against published literature (Chua et al.).

Stent-balloon assembly — inflated configuration with von Mises stress distribution
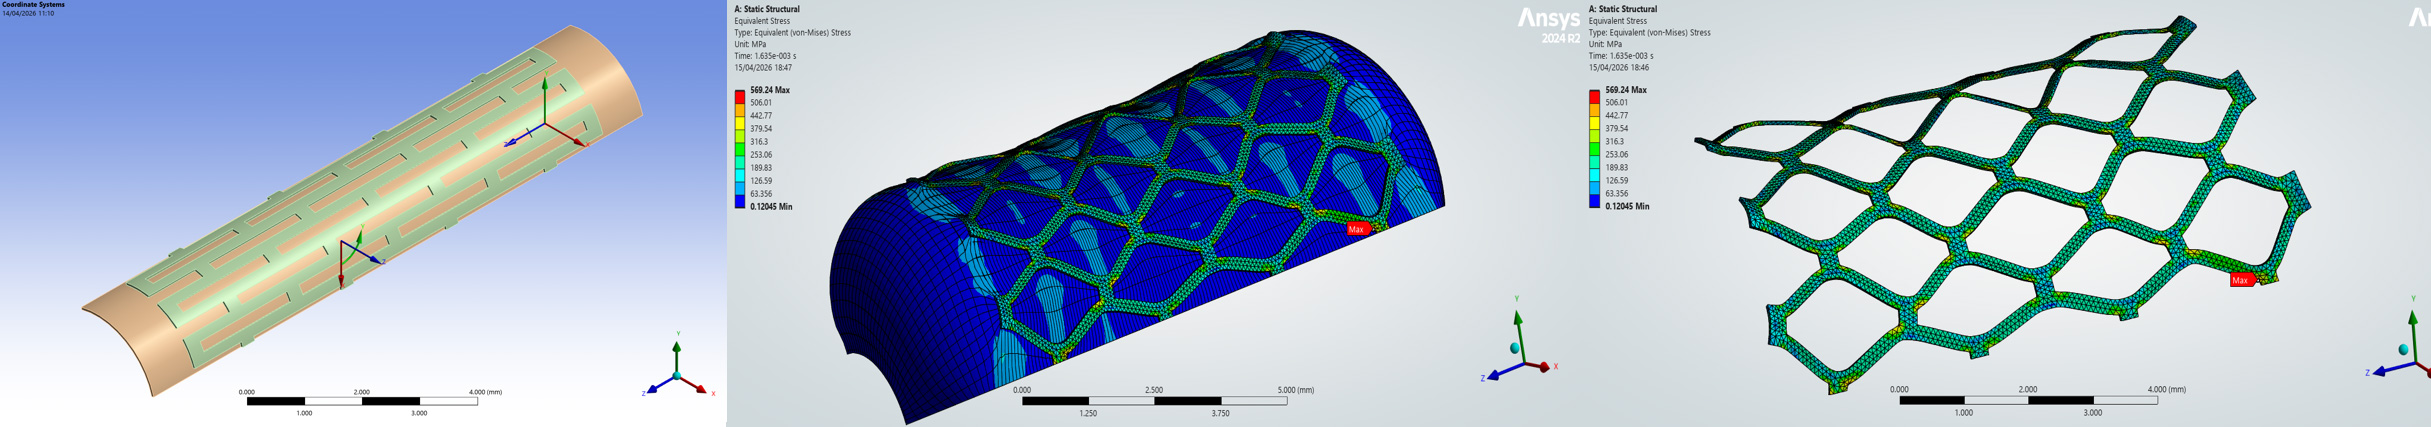
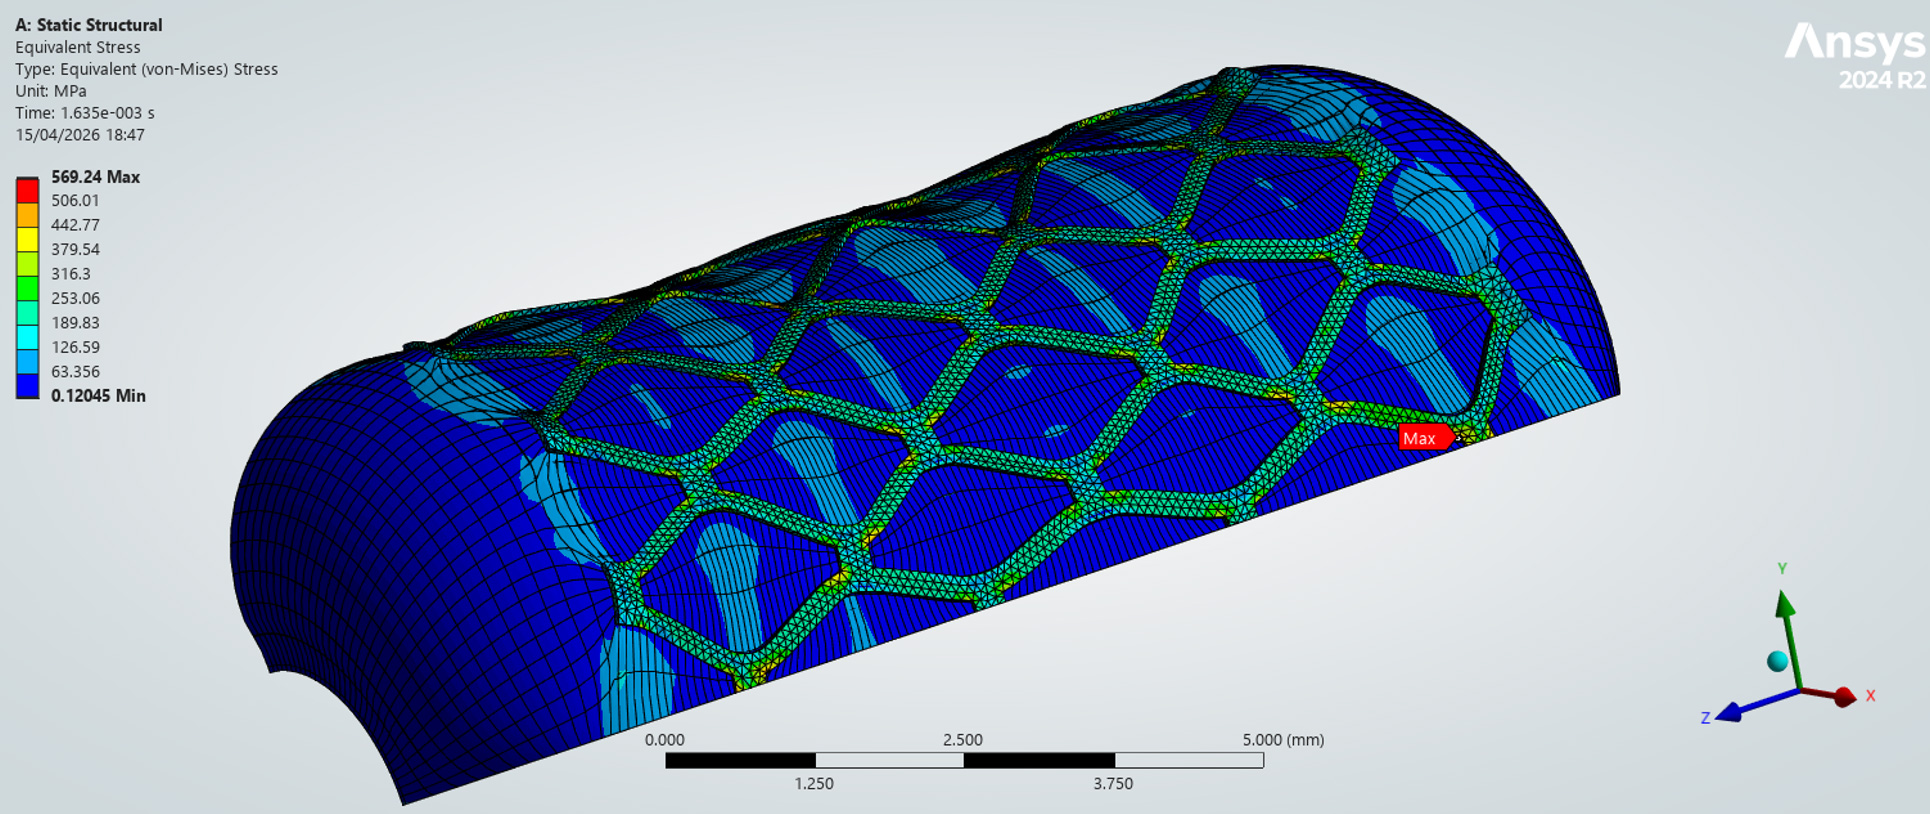
Stent–balloon assembly at peak inflation (0.409 MPa). Diamond-cell pattern opens radially; highest von Mises stresses concentrate at the inner cell crowns — the primary plastic hinge locations.
2025 – 2026 Group Project · Zihan: CAD & Parametric Analysis ANSYS Mechanical · SolidWorks MEC1054 Advanced FEA, DCU

How the Simulation Works

Three simultaneous nonlinearities

The balloon uses a Mooney-Rivlin hyperelastic model (C₁₀ = 1.069 MPa, C₀₁ = 0.711 MPa) to capture large-strain rubber-like behaviour. The SS304 stent uses bilinear isotropic hardening (E = 193 GPa, σ_y = 207 MPa, E_t = 692 MPa). Frictional surface-to-surface contact couples the two bodies. Internal balloon pressure ramps linearly from 0 to the target value over 1.635 ms, replicating the Chua et al. deployment protocol.

1

Elastic Loading Stage

At low pressures the balloon inflates and the stent responds elastically. All three pressure cases share a nearly identical stress trajectory — rapidly reaching ~270–280 MPa within the first 0.2 ms, dominated by elastic deformation with local yielding just initiating at cell corners.

2

Plastic Hinging & Nonlinear Divergence

After a short plateau, the three curves diverge sharply at ~0.8 ms. Once corner stress exceeds 207 MPa, plastic hinges form and the stent expands rapidly. Higher pressure drives a disproportionately larger stress jump and wider plastic zones through the strut network.

SolidWorks Geometry Preparation

My contribution to the group project included building the full stent geometry and the 1/4-symmetry model in SolidWorks before importing into ANSYS.

Full Stent Model

The complete stent was drawn in SolidWorks following the diamond-cell geometry specified in Chua et al., with uniform strut width and thickness. The geometry was parameterised for dimensional consistency before export.

1/4 Symmetry Simplification

Exploiting the two planes of symmetry in the stent–balloon assembly, a quarter-model was cut in SolidWorks and exported to ANSYS. This reduced the node count significantly while maintaining accurate prediction of stress distribution and radial expansion.

Key Results

Parametric study across three inflation pressures: 0.35 MPa, 0.409 MPa, and 0.50 MPa. Pressure applied as a linear ramp over 1.635 ms in all cases.

In short: The model reproduces Chua et al.'s deformation pattern and stress hotspot locations. The parametric study identified 0.409 MPa as the optimal deployment pressure — beyond this point, stress escalates disproportionately relative to additional diameter gain, increasing structural risk without meaningful clinical benefit.
1

Von Mises Stress–Time Response (Three Pressure Levels)

Fig 4.14 — Von Mises stress-time histories: 0.35 / 0.409 / 0.50 MPa
Fig 4.14 — Von Mises stress–time histories for 0.35 MPa, 0.409 MPa and 0.5 MPa. Curves show similar behaviour in the initial loading stage, followed by a pronounced divergence in the plastic regime.

In the early stage of loading, all three curves follow a very similar trend, with stress rising rapidly and reaching approximately 270–280 MPa within the first 0.2 ms — dominated by elastic deformation with local yielding initiating at the cell corners.

After a short plateau, the curves begin to separate clearly at around 0.8 ms. The response becomes strongly nonlinear, with stress increasing much more rapidly in the higher-pressure cases.

Peak von Mises stress at end of loading

0.35 MPa
~430 MPa
0.409 MPa (baseline)
~570 MPa
0.50 MPa
~750 MPa

A relatively small increase in applied pressure yields a disproportionately large increase in stress once plastic deformation has spread through the stent structure.

2

Deformed Configurations & Stress Contours

Fig 4.15 — Deformed stent at 0.409 MPa with von Mises stress contour
Fig 4.15 — Deformed configuration and equivalent von Mises stress at 0.409 MPa. Substantial radial expansion with noticeable foreshortening; high stresses concentrated at cell junctions extending into connecting struts.

0.409 MPa — Balanced deployment

A larger radial expansion is obtained and the stent cells open clearly, accompanied by noticeable axial foreshortening. The stress distribution becomes more widespread, with plastic zones extending further from the corner regions into the connecting struts. This case represents a balanced deployment condition — substantial expansion while the stress level, although significantly above yield (207 MPa), remains below the extreme values reached at 0.5 MPa.

Fig 4.16 — Comparison: 0.35 MPa (a) vs 0.50 MPa (b)
Fig 4.16 — (a) 0.35 MPa: modest expansion, plasticity localised at hinges. (b) 0.50 MPa: extensive plastic zone across strut network, pronounced dog-boning at balloon ends.

0.35 MPa — Under-expanded

The stent expands only moderately and the balloon remains nearly cylindrical. Stress is mainly concentrated at the hinges and junctions of the diamond cells — pressure is insufficient to drive more extensive deployment of the strut network.

0.50 MPa — Over-pressurised

Largest expansion, but at the cost of a very pronounced stress increase. High plastic deformation spreads across the strut network and the balloon ends exhibit a more pronounced dog-boning effect — further radial gain becomes structurally inefficient, with a much stronger rise in local stress.

Overall conclusion: The pressure–diameter response of the stent is markedly nonlinear. At low and intermediate pressures the structure expands in a relatively controlled manner, but once loading exceeds the baseline case of 0.409 MPa, the plastic response accelerates rapidly and stress rises much faster than the apparent geometric gain. Within the present model, 0.409 MPa is identified as the optimal reference deployment pressure — providing substantial expansion without the extreme stress escalation observed at 0.5 MPa.

Reflection

"This project gave me hands-on experience with the most demanding class of engineering simulation: problems where geometry, material, and boundary conditions all change simultaneously and nonlinearly. Designing and drawing the stent geometry in SolidWorks — including the 1/4-symmetry simplification — and then running the parametric pressure study built a complete end-to-end understanding of how CAD decisions directly affect simulation accuracy and result interpretation. Quantifying the nonlinear trade-off between deployment pressure, expansion gain, and structural stress showed me how FEA connects directly to real clinical engineering decisions."

Tools & Skills Applied

SolidWorks CAD

Full stent & 1/4 symmetry model

ANSYS Mechanical

Implicit quasi-static solver

Nonlinear FEA

Large deformation · Plasticity

Contact Mechanics

Frictional surface-to-surface

Hyperelasticity

Mooney-Rivlin balloon model

Parametric Study

3 pressure levels compared

Post-Processing

Stress contours · Time histories

Technical Writing

Advanced FEA Report, DCU 2026

Previous Project All Projects